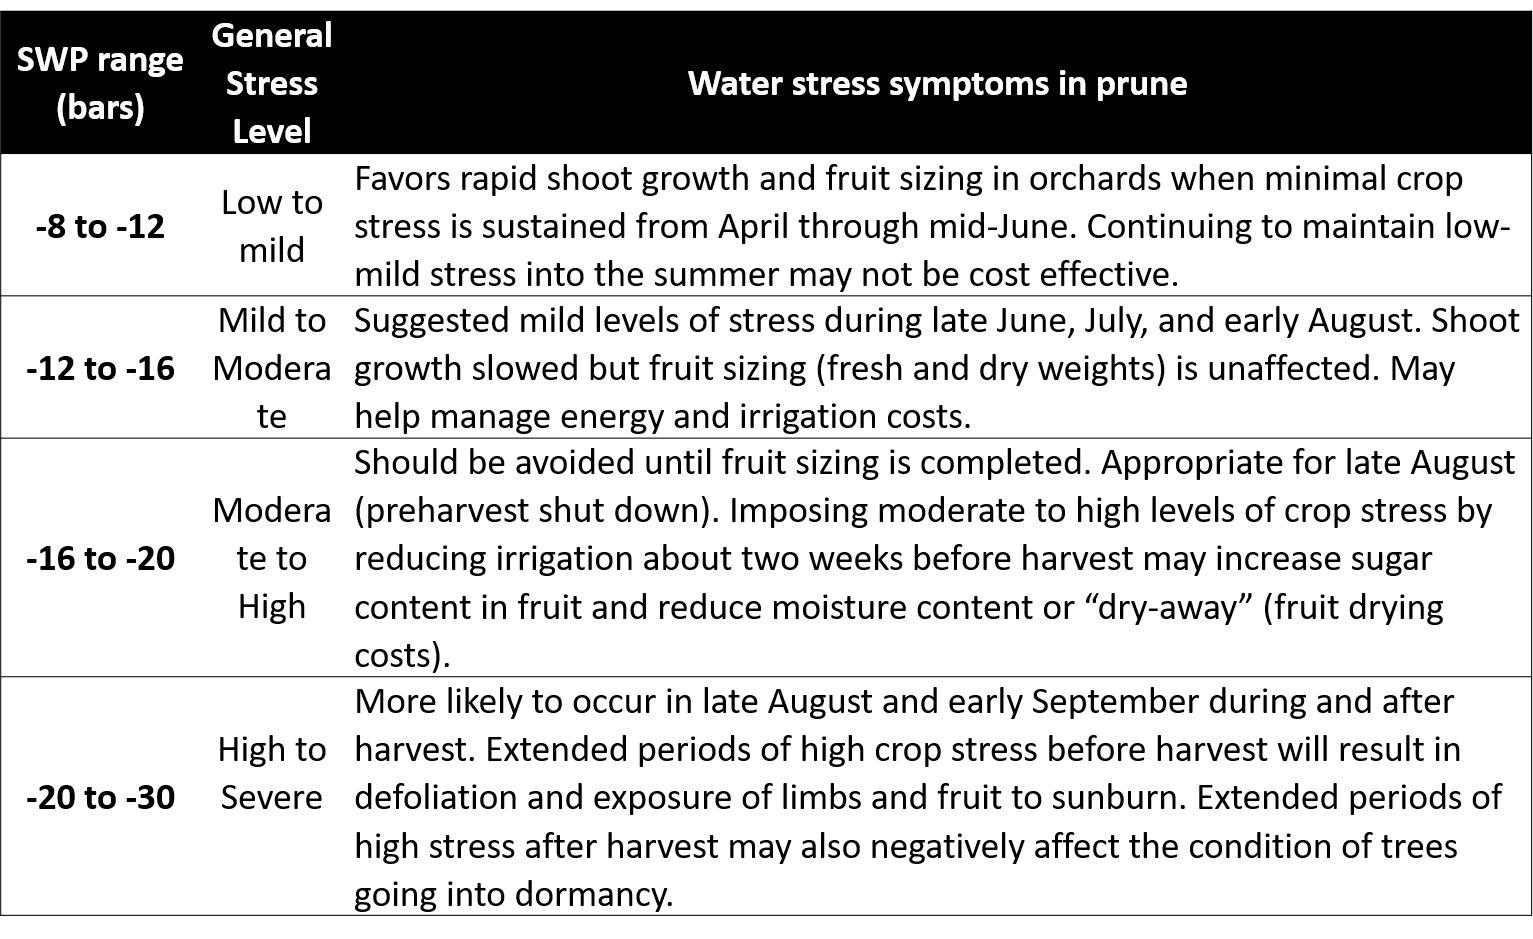
Table 1. SWP levels in prune, consideration of how SWP might compare to baseline values under various weather conditions, and the corresponding water stress symptoms to expect.
Sacramento Valley Orchard Source
Your source for orchard news & information in the Sacramento Valley


Leave a Reply