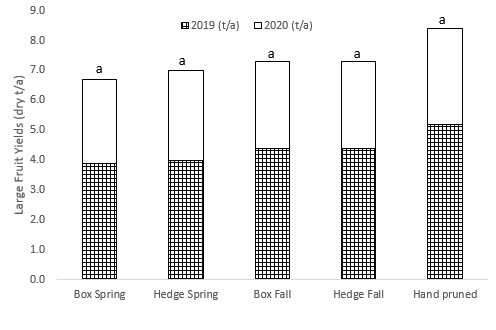
Figure 1. Dry fruit yields (A and B screens) in 2019 and 2020 in Tehama county (n =5) By Evie Smith | Published March 30, 2021 | Full size is 496 × 330 pixels Table 1.a Hand pruning... Figure2. Differences in canopy volume from hand and mechanical pruning treatments in 2019 and 2020. Figure 1. Dry fruit yields (A and B screens) in 2019 and 2020 in Tehama county (n =5). No significant differences were found. Figure 1. Dry fruit yields (A and B screens) in 2019 and 2020 in Tehama county (n =5). No significant differences were found. Leave a Reply Cancel replyYour email address will not be published. Required fields are marked *Comment * Name * Email * Website Δ
Leave a Reply