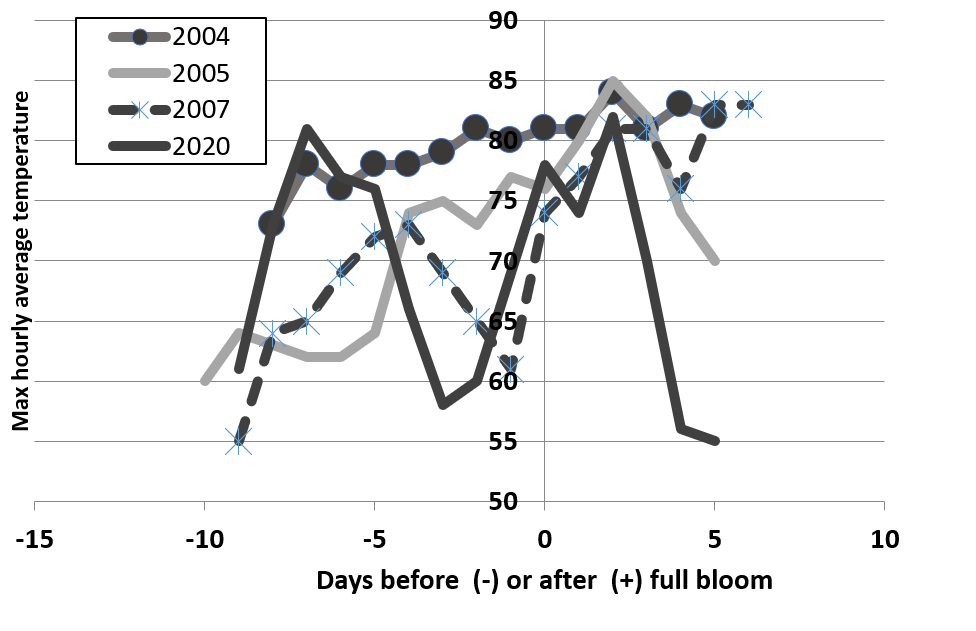
Figure 1. Timing of flower development during bloom and maximum average hourly temperatures in individual orchards in years with very low fruit set. All data are from Sutter County.
Sacramento Valley Orchard Source
Your source for orchard news & information in the Sacramento Valley


Leave a Reply