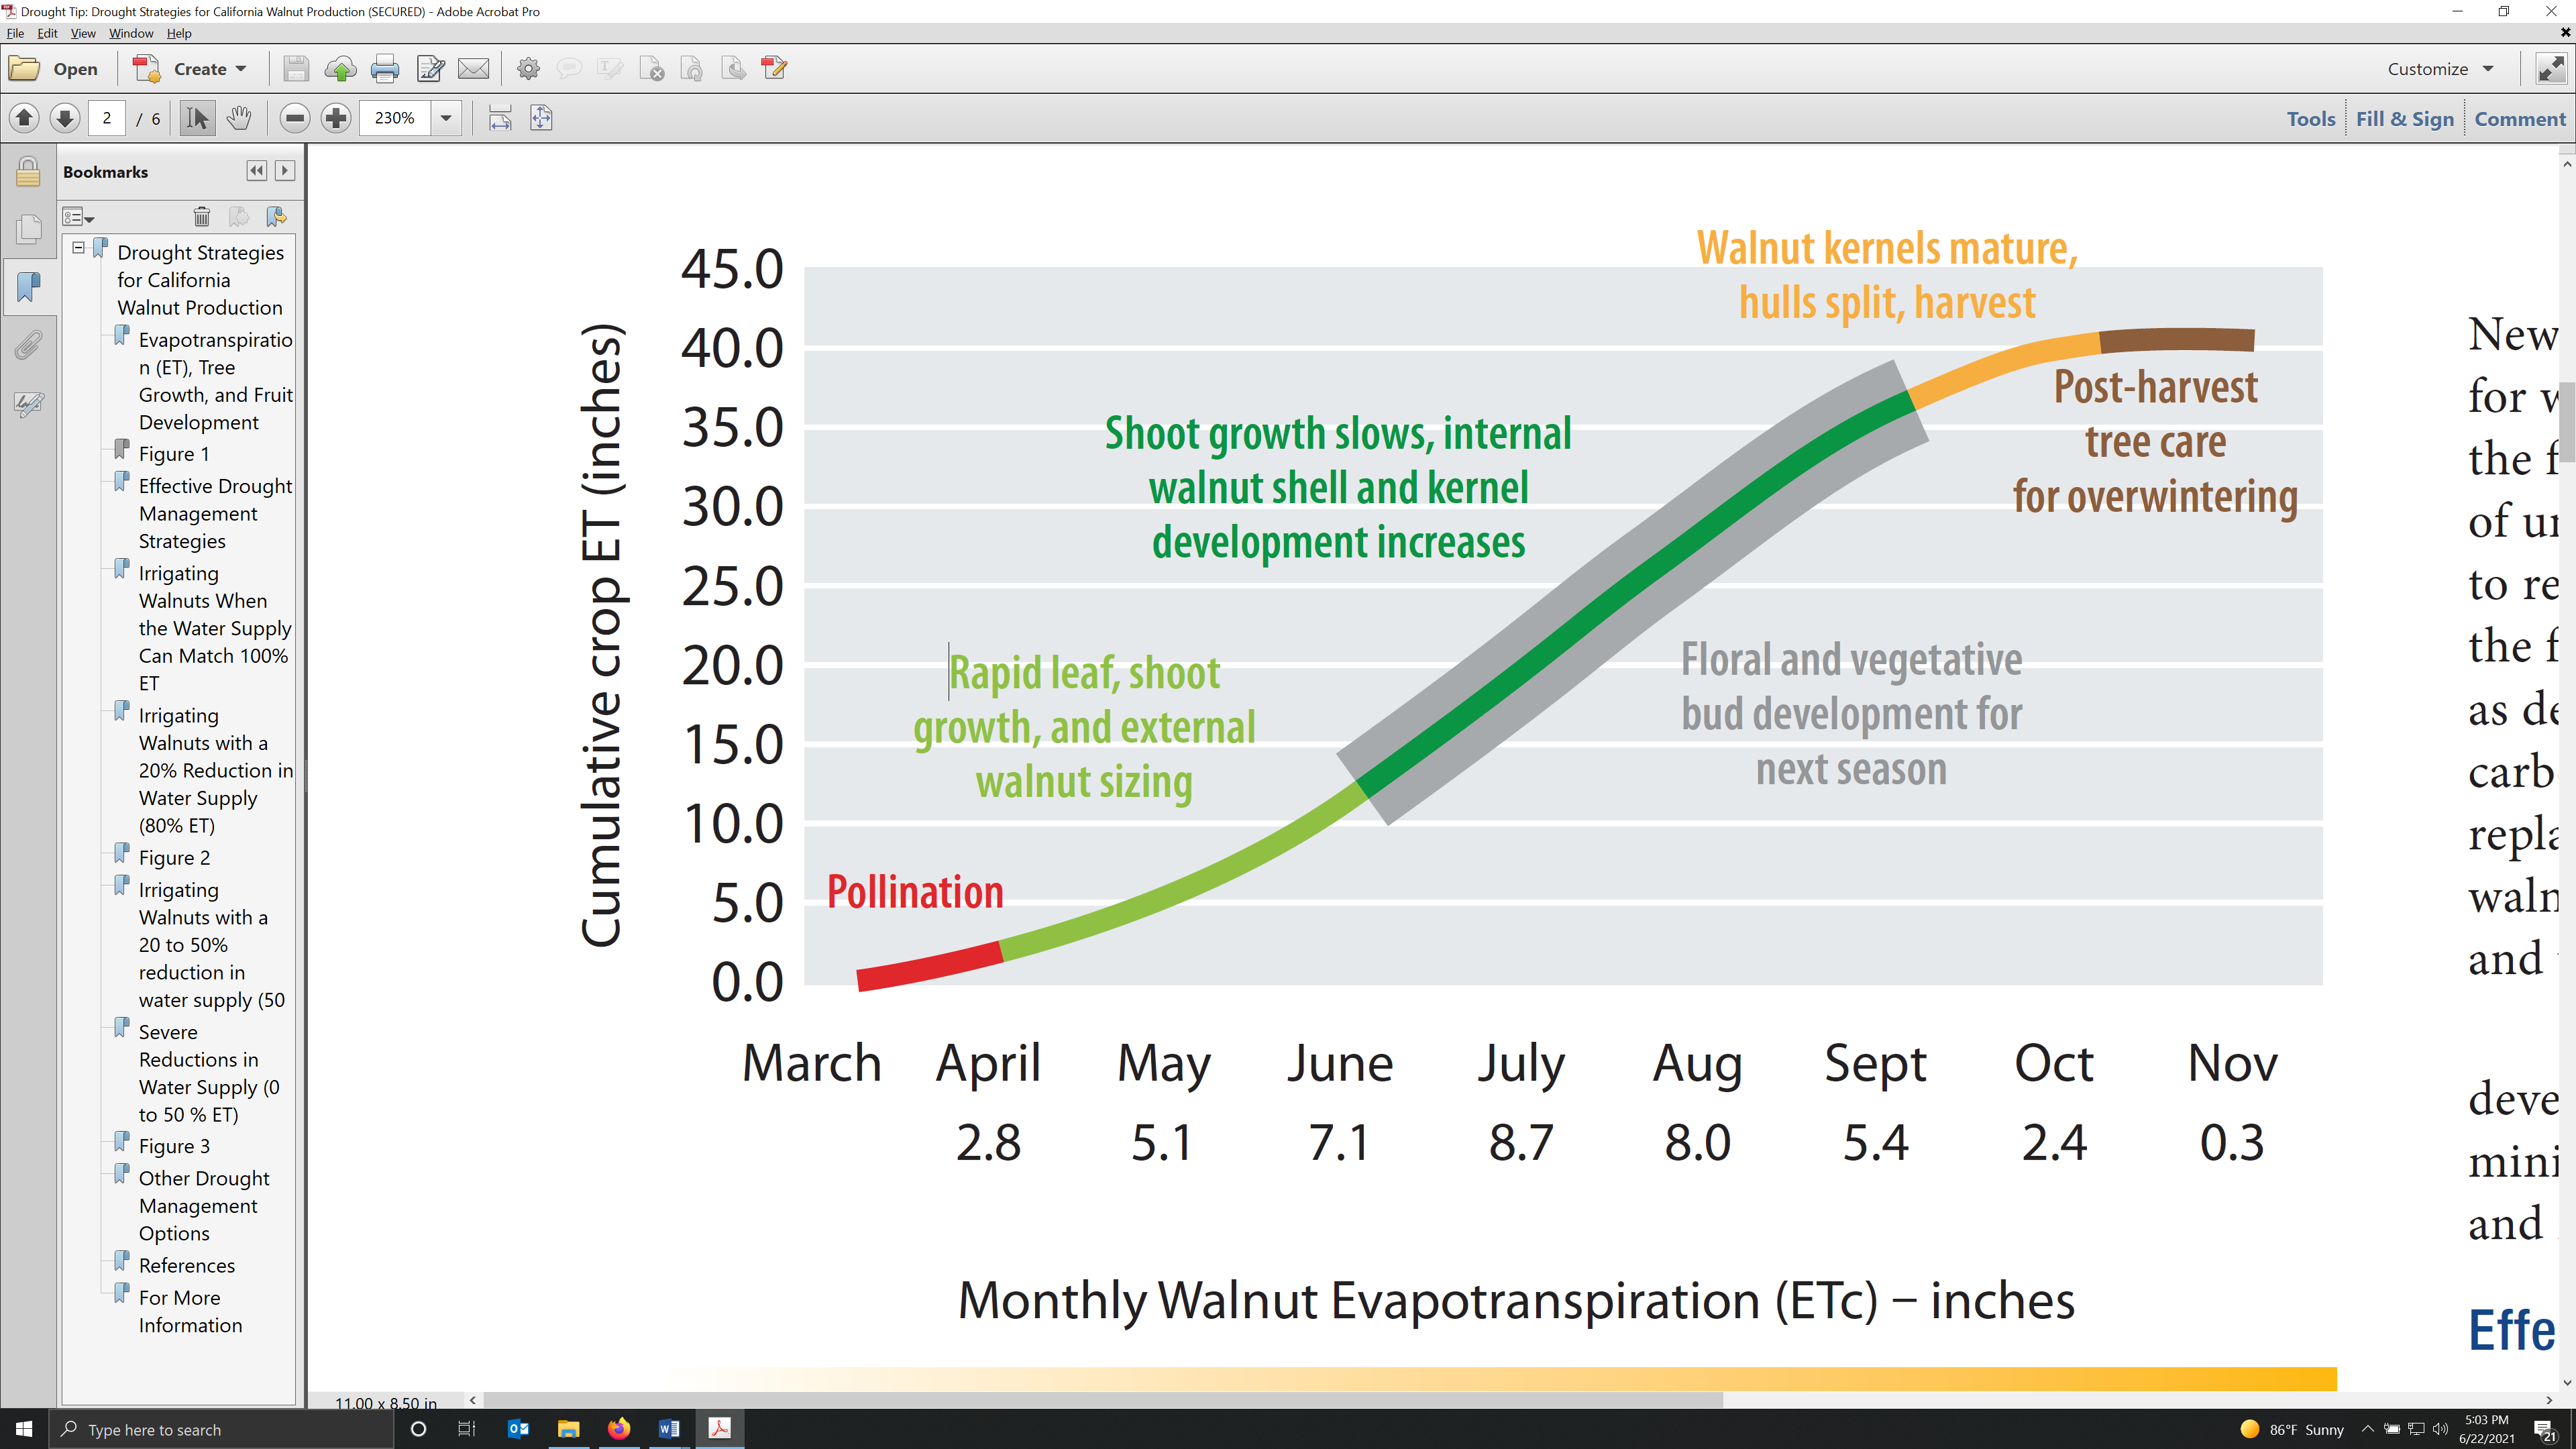
Figure 1. Cumulative and monthly average walnut evapotranspiration, tree growth and nut development over the growing season (Fulton & Buchner, 2015).
Sacramento Valley Orchard Source
Your source for orchard news & information in the Sacramento Valley


Leave a Reply