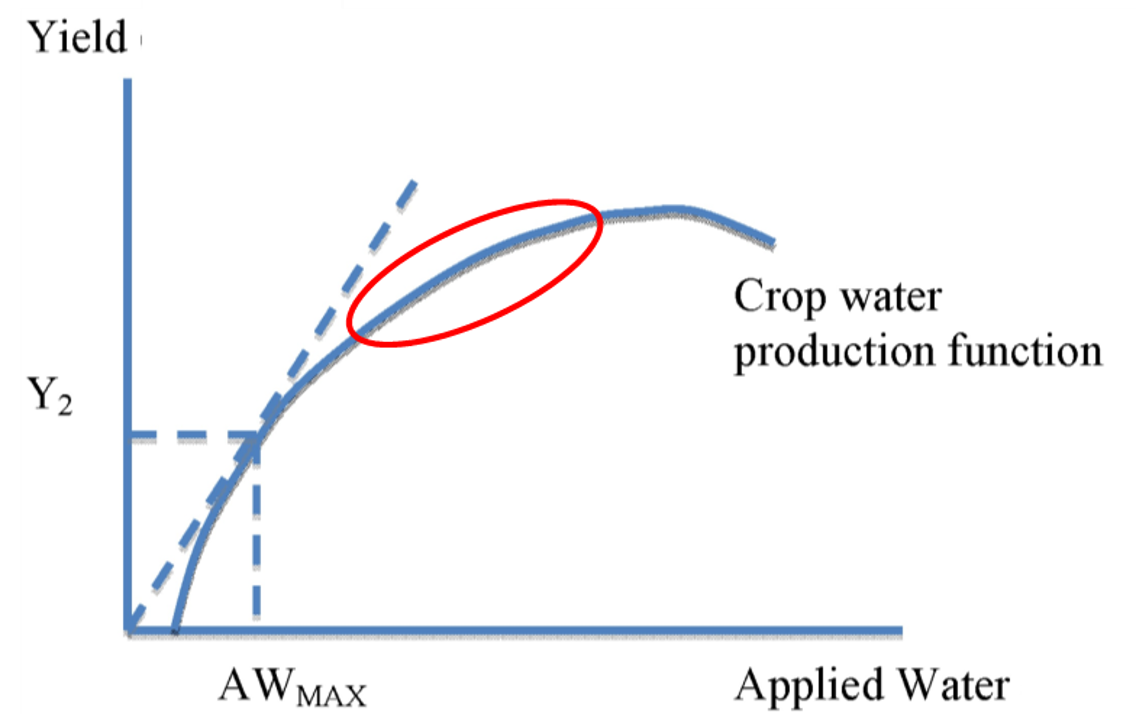
Figure 2. Hypothetical crop water production function modified from Wilchens, 2014. The red oval region indicates the opportunity for regulated deficit irrigation.
Sacramento Valley Orchard Source
Your source for orchard news & information in the Sacramento Valley


Leave a Reply